Data-Driven Defensible Brush Mapping for Premium Properties
Gain high-resolution, 3D insights into combustible vegetation—so you can meet Cal Fire’s defensible-space standards, lower your insurance costs, and sleep soundly knowing your investment is protected.
How It Works
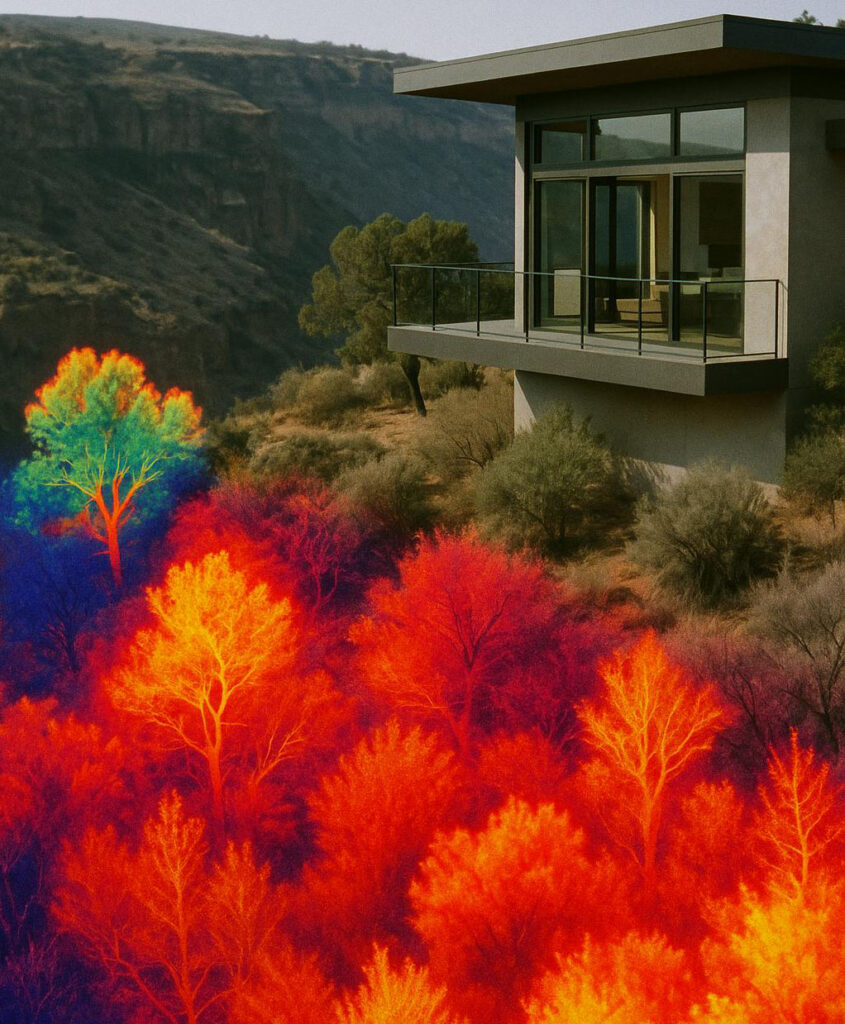
Aerial LiDAR & Thermal Survey
FAA-compliant drones capture ≥0.5 pts/m² point clouds and thermal data.
Machine-learning pipeline classifies vegetation fuel models within 48 hours.
Brush Density & Intrusion Mapping
Interactive GIS map flags zones exceeding combustible thresholds.
Automated alerts for vegetation intruding within 30 ft of structures, driveways, and chimneys.
Aerial LiDAR & Thermal Survey
FAA-compliant drones capture ≥0.5 pts/m² point clouds and thermal data.
Machine-learning pipeline classifies vegetation fuel models within 48 hours.
Why Defensible Space Matters
Zone 1 (0–30 ft)
“Low, Lean, and Green”: Minimize all combustible materials close to structures.
Zone 2 (30–100 ft)
Reduced Fuel Zone: Thin and separate vegetation to interrupt fire spread.
Meeting these standards isn’t just best practice—it’s often required by insurers and local fire ordinances.
Key Benefits
Precision Analysis
Quantify canopy bulk density, fuel weight, height, and base height for every acre.
Compliance & Savings
Demonstrate defensible-space compliance to unlock insurance premium discounts.
Rapid Turnaround
Fully processed, interactive reports delivered in 48 hours.
Ongoing Monitoring
Quarterly subscription plans track your mitigation progress year-round.